Evaluate and Envision the Future of E-mobility in China
ESG & Sustainability
Introduction
With rapid urbanisation, China is on the one hand benefiting from economic growth while on the other, suffering from environmental pollution. It was estimated that 51% of the study population in China (142 million) were exposed to air pollution which exceeded the World Health Organisation's limit (Han et al., 2018). Chengdu, the fourth largest city in China, was estimated for every USD100 earned in citizen’s disposable income, USD7 was deduced for public health services and negative externalities to the environment (Song, 2018).
Urbanisation also leads to higher demand for energy. However, the energy mix in China was mostly non-renewables such as coal, oil and gas (Dong et al., 2017). The transport sector in China consumed around half of the total oil consumption and 10% of total natural gas consumption (Fridley, Lu and Khanna, 2014). Road transport, in particular, had contributed up to 80% in the whole transport sector carbon emission in China (International Energy Agency, 2017).
National plans such as the “13th Five-year Development Plan for Transportation Energy Conservation and Environmental Protection” and “Guideline for Accelerating the Development of Circular, Green and Low Carbon Transportation” showed government’s determination to build a greener transportation sector (The Ministry of Transport of the People’s Republic of China, 2013; 2016).
Given this, this essay comes with two research questions: to what extent can China achieve 100% electrification in road transport by 2050? What are the major barriers? The essay will start with an overview of existing e-mobility strategies in China. After that, it will evaluate several 2030 scenarios from research papers and used as a basis to envision the market in 2050. Mission-oriented innovation policy (Mazzucato, 2017) and three-pillar policy model (Grubb, Hourcade and Neuhoff, 2015) will be used to provide policy suggestions. Conclusions will be made in the final session.
An Overview of China’s E-mobility Strategies
The E-mobility Market in China
E-mobility is the abbreviation of electromobility. It can be defined as “a road transport system based on vehicles that are propelled by electricity whose energy is supplied by a source of electricity outside the vehicle” (Grauers, Sarasini and Karlström, 2013, P.19).
China ranked the top in electric vehicles (EVs) manufacturing, sales and ownership globally. In 2017, more than half of the EVs sales happened in China (International Energy Agency, 2018). The country also owned 40% of the total EVs stock and in particular, the amount of electric bus and electric two-wheelers accounted for 99% of global stocks (International Energy Agency, 2018). A Shenzhen-based company, BYD, is one of the world’s largest EVs producers (Wang et al., 2017). Shenzhen is also the first city in the world that turned its buses fleet (more than 16,000 vehicles) into 100% electric and planned to convert all its taxis into 100% electric by 2020 (Gray, 2018).
Top-down Initiatives
As shown in figure 1, Zhang and Liu (2016) had summarised the supply-side and demand-side EV-related policies in China.
To name a few, generous subsidies were given to buyers, ranged from RMB 31,500-45,000 (GBP 3,600-5,145) on passengers vehicles and RMB 250,000-400,000 (GBP 28,580-45,720) on commercial vehicles (Wang et al., 2017). The government also provided shortcuts for obtaining vehicle registration plates which is very appealing to buyers because of the extremely low auction and lottery success rate (Wang et al., 2017).
And, from 2014 onwards, all vehicles procurement from the Beijing government should be electric vehicles (Beijing New Energy Passenger Vehicle Platform, 2014).
In 2018, a "cap and trade" system was released, allowing passenger car manufacturers to use EV credits to offset their average fuel consumption credits. The EV credits were given based on the performance of each EV produced and the credits could be traded among companies (Cui, 2018).
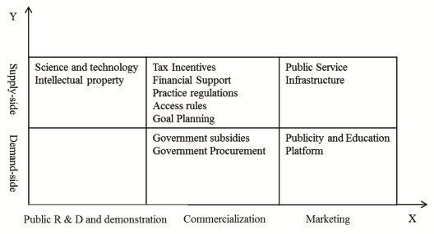
Figure 1. Policy Analysis Framework of EVs Industry (Source: Zhang and Liu, 2016)
The emphasis of low carbon transportation and growing demand for “mobility as a service” had created innovative business models and partnership among companies.
Didi Chuxing, a one-stop transportation platform, had over 400,000 EVs registered on its system. The company formed a joint venture with one of the largest EVs manufacturers in China to expand their fleets and provide users with comprehensive EV services (Didi Chuxing, 2019). Besides, an electric car-sharing company Kandi provided micro public transit solutions in Hangzhou and used vertical parking technology to vend their vehicles (Scherf and Wolter, 2016).
To sum up, the government’s willingness to mitigate environmental pollution, to nurture the local automobile industry and to support the EVs industry as one of the national strategy pillars had contributed to the flourishment of the e-mobility market (Du, Ouyang and Chen, 2017).
However, it is argued that the drastic market growth was the result of tremendous government subsidies, while not the natural cause from the market economy (Masiero et al., 2016). In addition, eco-innovation came in different phrases: invention, innovation and diffusion (Grubb, Hughes and Drummond, 2016). Policy push strategies such as subsidies may accelerate technological diffusion, but it may not necessarily help to commercialise the best technology to the market.
The government was also being blamed of focusing too much on the car industry and neglect other problems such as the lack of charging facilities, unstandardised electric vehicles technologies and local protectionism (Wan, Sperling and Wang, 2015; Li et al., 2016).
Scenarios for the Future of E-mobility in China by 2030
In 2020, the targeted cumulative production and sales of pure EVs and plug-in hybrid vehicles in China is five million (The Chinese State Council, 2012). By 2030, China is committed to reaching its peak carbon emissions and adopt 20% of renewables in their total energy production (The White House Office of the Press Secretary, 2014; National Development and Reform Commission, 2016).
This session will evaluate several e-mobility scenarios related to the types of vehicles used, greenhouse gas (GHG) emissions, energy savings and resource recovery potential by 2030.
Types of Vehicles Used
Mittal, Dai and Shukla (2016) used bottom-up energy-economic-environmental approach to model energy consumption by technology as well as fuel mix in China. They created two scenarios: business-as-usual scenario (BAU) with no policy changed; low carbon scenario (LCS) where the carbon tax was implemented and fuel efficiency was improved to match with global emissions target.
To start with, they estimated the total passenger kilometres for different transport mode as a basis for modelling. There was an increasing trend of using faster and more personalised cars compare with public transportation such as bus and metro (Mittal, Dai and Shukla, 2016). In figure 3, both BAU and LCS indicated fossil fuel cars ranked first in energy consumption while there were a significant increase in hybrid bus and electric vehicles in LCS compared with BAU in 2030. Figure 4 reflected on the high consumption of oil in both scenarios.
Similarly, Liu et al. (2018) also forecasted fossil fuel cars (indicated as “ICE” in figure 5) would take over more than 50% of vehicle market shares while other EVs will gradually become mainstream by 2030. These analyses had taken into account of the latest policies such as the cap and trade credit system, increasing efficiency and lower cost of the combustion engine, and barriers such as uncertainty on future battery technology, insufficient charging facilities (Liu et al., 2018).

Figure 2. Mode share in China (Source: Mittal, Dai and Shukla, 2016)
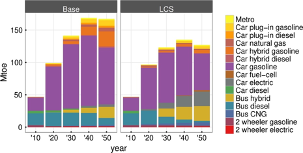
Figure 3. Energy by technology in China (Source: Mittal, Dai and Shukla, 2016)
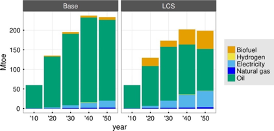
Figure 4. Urban transport fuel mix in China (Source: Mittal, Dai and Shukla, 2016)
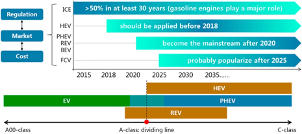
Figure 5. Judgments of different technology pathways (Source: Liu et al., 2018)
Both research papers did not forecast the number of vehicles sold by sector (governmental use, public transport, business use, private use). These data are vital because we could then understand the policy influence on EV sales in a particular sector and identify the gaps to achieve 100% electrification.
Also, both research should take note of the public purchasing power as there might be over-estimation on the willingness and financial capacity of citizens in buying EVs (Tagscherer and Frietsch, 2014). For example, a survey in Shanghai indicated factors such as current technology, environmental awareness and perceived risk affect public acceptance of EVs (Wang, Tang and Pan, 2018). In addition, the government tax credit or subsidy for individual buyers might phased out gradually after 2020 which could lead to a potential drop in EVs sales (Wang, Tang and Pan, 2017). These uncertainties are suggested to add into the assumptions.
The models can also take into account of a recent policy which could accelerate the technological change and improve sales. The government had recently removed the maximum of 49% ownership cap for foreign EVs car companies (National Development and Reform Commission, 2018), which might attract more foreign companies to set up their businesses in China.
GHG reduction and energy savings
He and Chen (2013) used LEAP model to measure the GHG reduction and energy savings of five types of vehicles, which can be seen in figure x. Five scenarios were created: business as usual scenario (BAU) represented no change in technology and all vehicles used fossil fuels; Electric vehicle scenario (EVS) included the adoption of electric vehicles and indirect carbon emission from the use of fossil-based electricity; Hybrid vehicle scenario (HVS) represented the use of full HV and plug-in HV vehicles; Combined scenario (CS) promoted both EV and HV; Improved combined scenario (ICS) included more charging facilities and improved technology, and with the highest market shares of EV and HV. The model had proved ICS was the most preferred scenario to reduce oil use and carbon emission (He and Chen, 2013).

Figure 6. Vehicles classification (Source: He and Chen, 2013)
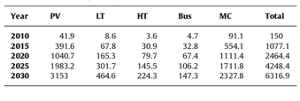
Figure 7. Vehicle stock estimate (million) (Source: He and Chen, 2013)
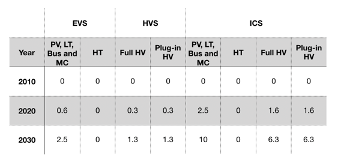
Figure 8. HV and EV vehicle application rates (%) in EVS, HVS and ICS (Data Source: He and Chen, 2013)
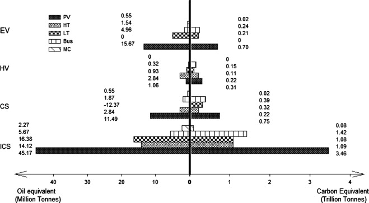
Figure. 9. Cumulative energy saving (left) and GHG reduction (right). Compared with BAU (Source: He and Chen, 2013)
The above scenario is mostly focusing on the use phase of carbon emission and energy savings. A carbon neutral scenario can be added to calculate the life cycle carbon emission of electric vehicles (a system boundary could be set from manufacturing, use to disposal phase) and offset it by solutions such as investing in renewables or planting trees. A renewable scenario can also be used to calculate the energy savings if the manufacturing and disposal phase of the vehicles are using renewables in 2030. These scenarios may appeal to environmentally conscious consumers and advice government officials the incentives and barriers to push forward the production of a 100% green and clean electric car.
It is also recommended to take into account the rebound effects of using EVs (Font Vivanco et al., 2014). In the past, there was empirical evidence in China about the rebound effects in the household electricity sector due to an increase in energy efficiency (Wang, Lu and Wang, 2014). Therefore, a similar situation may occur in the EV sector as well.
Resource recovery potential
When the future of road transport is gradually replaced by electric vehicles, it is essential to look into battery recycling, which consists of rare earth materials. Yano, Muroi and Sakai (2016) calculated the resource recovery potential of rare earth in hybrid electric vehicles. The research forecasted the number of cars reached its end life between 2010-2030 and estimated if all rare earth materials were recycled, they could satisfy 35.4% demand in hybrid transmissions and 92.1% demand in battery units manufacturing (Yano, Muroi and Sakai, 2016).
Even though the research used Japan as a case study, it can be modified and apply in the Chinese market. The model can start with a BAU scenario where the recycling of electric vehicles is based on the existing vehicle recycling rate and existing policy in China. Then, an enhanced recycling scenario can be adopted where EVs recycling is incentivised or encouraged by the government. Lastly, an optimistic recycling scenario can be used where 100% of electric vehicles are recycled at their end life. A life cycle assessment can also be implemented to evaluate the energy used to recover the rare earth materials to find out the net environmental benefits. The comparison of modelling results may provide policy guidance on rare earth materials recovery.
Based on the above forecast, we may assume in 2030 the fossil fuel vehicles are still mainstream even though the number of EVs are increasing; the technology has improved to allow both fossil fuel and electric vehicles to achieve its optimal energy efficiency and finally, there will be more emphasis on rare earth materials recovery.
To further envision the future, this is how I foresee the e-mobility in China will be like by 2050:
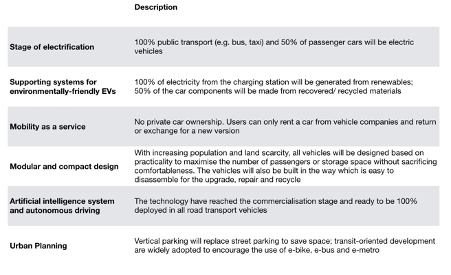
Table 1. China’s E-mobility in 2050
The government is advised to design policies based on the mission-oriented thinking presented by Mazzucato (2017), which aimed to solve “problem-specific societal challenges”. The mission can be set as: to achieve 100% electrification in road transportation by 2050. With the system thinking mindset, the policies would not merely focus on the transportation or manufacturing sector, but to encourage co-creation with other governmental departments.
A three-pillar policy framework from Grubb, Hourcade and Neuhoff (2015) is adopted to illustrate some policy recommendations:
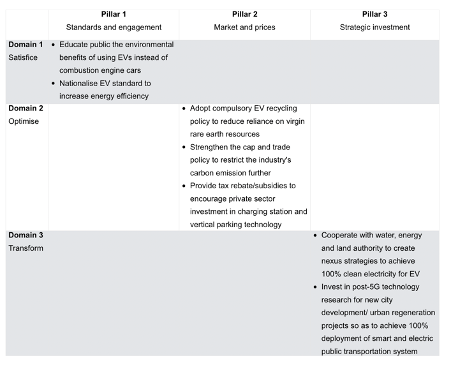
Table 2. Mission-oriented policy recommendations based on the framework from Grubb, Hourcade and Neuhoff (2015)
Conclusions
China’s rapid economic growth is accompanying with severe air pollution, which is, to a certain extent, due to the increasing numbers of vehicles on the road as well as their heavy dependence on fossil fuels.
The Chinese government is determined to improve the situation and set e-mobility as a national strategy. Fiscal and non-fiscal measures are adopted to induce supply and demand for electric vehicles, such as subsidies to buyers, carbon "cap and trade" system and open up the electric car industry for foreign companies. Some bottom-up partnerships and innovations are also initiated.
This paper also analysed several scenarios of e-mobility in 2030 related to the types of vehicles, GHG and energy savings as well as resource recovery potential and provide suggestions on scenario improvement. The major findings are: in 2030, fossil fuels vehicles are still dominating the road transport market; there will be a vast improvement in energy efficiency and carbon reduction in fossil fuels and electric vehicles; rare earth materials will be widely recovered and used for new vehicles production. Then, the future of e-mobility in 2050 is envisioned based on the 2030 scenarios.
In short, I believe China could electrify all its public transport (e.g. e-bus and e-taxi) by 2050 while there maybe only 50% of the vehicles in the private sector are electric. Some major barriers are identified such as insufficient charging power station, uncertainty on electricity generation capacity to meet with enormous demand and uncertain purchasing power from the general public when all government subsidies are removed. Mission-oriented policy recommendations are suggested which hope to accelerate the progress of achieving 100% electrified road transport.
References
- Beijing New Energy Passenger Vehicle Platform (2014) Beijing Electric Vehicle Promotion and Application Action Plan (2014-2017). Available in Chinese at: https://www.bjxnyqc.org/news/detail/1386 (Accessed: 31 March 2019). Archived at https://perma.cc/G2CV-CQ6S
- Cui, H. (2018) China’s New Energy Vehicle Mandate Policy, The International Council on Clean Transportation.
- Didi Chuxing (2019) Didi Chuxing Sets up JV with BAIC-BJEV, China’s Largest EV Maker. Available at: https://www.didiglobal.com/news/newsDetail?id=624&type=news (Accessed: 31 March 2019). Archived at https://perma.cc/4P8D-S9AF
- Dong, K. Y., Sun, R. J., Li, H. and Jiang, H. D. (2017) ‘A review of China’s energy consumption structure and outlook based on a long-range energy alternatives modeling tool’, Petroleum Science, 14(1), pp. 214–227.
- Du, J., Ouyang, M. and Chen, J. (2017) ‘Prospects for Chinese electric vehicle technologies in 2016–2020: Ambition and rationality’, Energy, 120, pp. 584–596.
- Font Vivanco, D., Freire-González, J., Kemp, R. and Van Der Voet, E. (2014) ‘The remarkable environmental rebound effect of electric cars: A microeconomic approach’, Environmental Science and Technology, 48(20), pp. 12063–12072.
- Fridley, D., Lu, H. and Khanna, N. (2014) ‘Key China Energy Statistics 2016’, China Energy Group, pp. 1–71.
- Grauers, A., Sarasini, S. and Karlström, M. (2013) Why Electromobility and What Is It?, Systems Perspectives on Electromobility.
- Gray, A. (2018) Shenzhen just made all its buses electric, and taxis are next, World Economic Forum. Available at: https://www.weforum.org/agenda/2018/11/shenzhen-just-made-all-its-buses-electric-and-taxis-are-next/ (Accessed: 31 March 2019). Archived at https://perma.cc/Z7XS-MPNG
- Grubb, M., Hourcade, J. and Neuhoff, K. (2015). The three domains structure of energy-climate transitions. Technological Forecasting and Social Change, 98, pp. 290-302.
- Grubb, M., Hughes, N. and Drummond, P. (2016) Electricity in Transition: Economic and Policy Dimensions, UCL Energy Institute and Institute of Sustainable Resources.
- Han, L. et al. (2018) ‘Multicontaminant air pollution in Chinese cities’, Bulletin of the World Health Organization, 96, pp. 233–242.
- He, L. Y. and Chen, Y. (2013) ‘Thou shalt drive electric and hybrid vehicles: Scenario analysis on energy saving and emission mitigation for road transportation sector in China’, Transport Policy. Elsevier, 25, pp. 30–40.
- International Energy Agency (2017) CO₂ Emissions from Fuel Combustion 2017 - Highlights, IEA Publications.
- International Energy Agency (2018) Global EV Outlook 2018, IEA Publications.
- Li, Y., Zhan, C., de Jong, M. and Lukszo, Z. (2016) ‘Business innovation and government regulation for the promotion of electric vehicle use: lessons from Shenzhen, China’, Journal of Cleaner Production, 134, pp. 371–383.
- Masiero, G., Ogasavara, M. H., Jussani, A. C. and Risso, M. L. (2016) ‘Electric Vehicles in China: BYD Strategies and Government Subsidies’, Review of Administration and Innovation - RAI, 13, pp. 3–11.
- Mazzucato, M. (2017) Mission-Oriented Innovation Policy: Challenges and Opportunities, UCL Institute for Innovation and Public Purpose Working Paper.
- Mittal, S., Dai, H. and Shukla, P. R. (2016) ‘Low carbon urban transport scenarios for China and India: A comparative assessment’, Transportation Research Part D: Transport and Environment, 44, pp. 266–276.
- National Development and Reform Commission (2016) 13th FYP development plan for renewable energy. Available in Chinese at: https://www.ndrc.gov.cn/zcfb/zcfbghwb/201612/W020161216661816762488.pdf (Accessed: 31 March 2019). Archived at https://perma.cc/2RJL-YJ3L
- National Development and Reform Commission (2018) National Development and Reform Commission: develop a new negative list of foreign investment and the issue of openness in the manufacturing industry. Available in Chinese at: https://www.ndrc.gov.cn/xwzx/xwfb/201804/t20180417\_882711.html (Accessed: 31 March 2019). Archived at https://perma.cc/PJ2W-MUHR
- Scherf, C. and Wolter, F. (2016) Electromobility: Overview, Examples, Approaches, Deutsche Gesellschaft für Internationale Zusammenarbeit (GIZ) GmbH.
- Song, S. (2018) ‘Assessment of transport emissions impact and the associated social cost for Chengdu, China’, International Journal of Sustainable Transportation, 12(2), pp. 128–139.
- Tagscherer, U. and Frietsch, R. (2014) E-mobility in China: Chance or daydream?, Fraunhofer ISI Discussion Papers Innovation Systems and Policy Analysis No. 40.
- The Chinese State Council (2012) Notice of the State Council on Printing and Distributing the National Twelfth Five-Year National Strategic Emerging Industry Development Plan. Available in Chinese at: https://www.gov.cn/zwgk/2012-07/20/content\_2187770.htm (Accessed: 31 March 2019). Archived at https://perma.cc/Y4AC-B2X9
- The Ministry of Transport of the People’s Republic of China (2013) Guideline for Accelerating the Development of Circular, Green and Low Carbon Transportation. Available in Chinese at: https://www.gov.cn/gongbao/content/2013/content\_2466586.htm (Accessed: 20 March 2019). Archived at https://perma.cc/AHZ2-Q5D2
- The Ministry of Transport of the People’s Republic of China (2016) 13th Five-year Development Plan for Transportation Energy Conservation and Environmental Protection. Available in Chinese at: https://www.waizi.org.cn/law/16623.html (Accessed: 31 March 2019). Archived at https://perma.cc/E2TJ-H35D
- The White House Office of the Press Secretary (2014) U.S.-China Joint Announcement on Climate Change. Available at: https://obamawhitehouse.archives.gov/the-press-office/2014/11/11/us-china-joint-announcement-climate-change (Accessed: 31 March 2019). Archived at https://perma.cc/9MEY-N69F
- Wan, Z., Sperling, D. and Wang, Y. (2015) ‘China’s electric car frustrations’, Transportation Research: Part D, 34, pp. 116–121.
- Wang, N., Tang, L. and Pan, H. (2017) ‘Effectiveness of policy incentives on electric vehicle acceptance in China: A discrete choice analysis’, Transportation Research Part A: Policy and Practice, 105, pp. 210–218.
- Wang, N., Tang, L. and Pan, H. (2018) ‘Analysis of public acceptance of electric vehicles: An empirical study in Shanghai’, Technological Forecasting and Social Change, 126, pp. 284–291.
- Wang, Y. et al. (2017) ‘China’s electric car surge’, Energy Policy, 102, pp. 486–490.
- Wang, Z., Lu, M. and Wang, J.-C. (2014) ‘Direct rebound effect on urban residential electricity use: An empirical study in China’, Renewable and Sustainable Energy Reviews, 30, pp. 124–132.
- Yano, J., Muroi, T. and Sakai, S. ichi (2016) ‘Rare earth element recovery potentials from end-of-life hybrid electric vehicle components in 2010–2030’, Journal of Material Cycles and Waste Management, 18(4), pp. 655–664.
- Zhang, L. and Liu, Y. (2016) ‘Analysis of New Energy Vehicles Industry Policy in China’s Cities from the Perspective of Policy instruments’, Energy Procedia, 104, pp. 437–442.
Comments