Material Flow Analysis and Life-Cycle Assessment: the hybrid approach
ESG & Sustainability

Introduction
Chemical substances such as mercury, lead and zinc were commonly found in electrical and electronic equipment (EEE) (Tsydenova and Bengtsson, 2011). Improper manufacturing and disposal of EEE could contaminate the environment and pose a threat to human health (Frazzoli et al., 2010).
Ikhlayel (2017) analysed different methods used in wasted EEE (WEEE) treatment processes and concluded that landfilling was the least preferred disposal option due to the chance of heavy metals leakage to the environment. Also, the use of high-pressure compaction treatment process before landfilling could accelerate the number of harmful substances released (Niu and Li, 2007). Reduce, reuse and recycle of WEEE were therefore promoted as better waste treatment alternatives. These methods, on the one hand, could generate economic values via repair and resale of materials; on the other hand, they could lower greenhouse gas emissions and energy used in primary extraction of natural resources (Kumar et al., 2017).
In a global perspective, the Basel Convention was released in 1989 to regulate the transboundary movement of WEEE and regarded illegal for developed countries to ship WEEE to developing countries (Lepawsky, 2014). Still, developed countries found loopholes and exported a large amount of non-functioning EEE with the name of donation or reuse, or illegally exported to countries where the foreign WEEE were banned (Ghosh et al., 2016; Ladou and Lovegrove, 2008). The challenge of WEEE also includes informal waste treatment process, ineffective recycling policy and insufficient industry incentives (Herat and Agamuthu, 2012; Tansel, 2017).
The purpose of this essay is to understand the resource flow of one category of EEE and the environmental impact bought from a specific electrical appliance. To start with, the category of small household appliances (SHA) is selected to investigate its waste flow via material flow analysis (MFA). Then, an electric kettle (which is categorized as SHA) is chosen to evaluate its environmental impact using life-cycle assessment (LCA). The results are analysed in a hybrid approach. Finally, policy recommendations will be briefly discussed.
Methodology
Elements in MFA
MFA is applied to assess the flow of materials within a defined scope, from beginning to the end of the cycle, through calculating the balance between the input and output of resources (Brunner and Rechberger, 2004). Six steps are generally involved: select types of materials, define the space and time of studies, identify system flows, data collection and calculation and result interpretation (Brunner and Rechberger, 2004). MFA was applied to analyse the material flow of different EEE (Lau et al., 2013; Steubing et al., 2010; Tran et al., 2018).
In this essay, the material flow of SHA is calculated. The geographical location is set in the UK and focus in the year 2016. The boundaries start from the number of products put on the market to the end-of-life of the product. Data were obtained from EUROSTAT and the material flow is visualised with Sankey diagrams.
Elements in LCA
LCA is defined as “an analytical tool that captures the overall environmental impacts of a product, process or human activity from raw material acquisition, through production and use, to waste management.” (Rebitzer et al., 2004, p. 273). There are four steps in the LCA based on ISO 14040: goal and scope definition, inventory analysis, impact assessment and result interpretation (Rebitzer et al., 2004).
The goal of this LCA study is to analyse the environmental impact of an electric kettle. The “cradle-to-grave” approach is used to define the scope of the study, which captures the environmental impact of raw materials, assembly stage, use stage to the disposal stage.
The LCA data were obtained from Gallego-Schmid et al. (2018): six types of inventory data were selected (645g stainless steel, 24g brass, 19g copper, 419g polypropylene, 57g polyvinyl chloride and 36g nylon); 1.4 kWh high voltage electricity was used in assembly stage; the functional unit was the use of 829 kWh of electricity in the lifetime of 4.4 years; transoceanic freight ship was used to transport kettle from manufacturer to retailer.
The kettle was assumed to be manufactured in Shenzhen, China while the use stage and disposal stage are both in London, the United Kingdom (the UK). It was also assumed small size private car was used to carry kettle from retailer to home, and from home to WEEE collection centre; 16-32 metric ton lorry was used from warehouse to retailer and from WEEE collection centre to waste treatment plant.
Two scenarios are assumed at the disposal stage: a “realistic” scenario representing a factual situation presented in Gallego-Schmid et al. (2018) and an “optimistic” scenario representing a higher recovery situation. In an optimistic scenario, it is assumed a higher recycling rate while lower landfill and incineration rate compared with the realistic scenario, based on the vision from European Commission: “[b]y 2030, more than half of plastics waste generated in Europe is recycled.” (European Commission, 2018, p. 9). The method of ReCiPe Midpoint (H) is used at the impact assessment stage.
The system boundary is illustrated as follows:
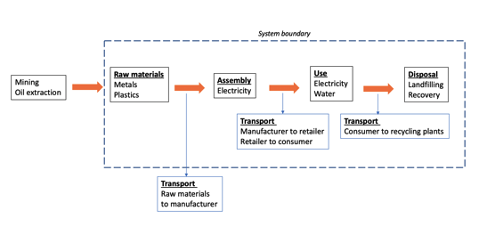
Fig 1. System boundaries of electric kettle life cycle
Limitations of the analysis
Due to the limited data availability provided by the EUROSTAT, some stages in MFA was missing. Therefore, assumptions will be made from two research of WEEE waste treatment in the UK: WRAP (2016) and Clarke et al. (2019) with the option of reuse, recycle, export, waste to energy (incineration) and landfill. Lifespan distribution is not considered in this MFA.
In the LCA, some materials in the assembly stage are not included. Besides, the packaging materials, water and heat used in the assembly process are excluded; the transport of virgin materials to the manufacturer is excluded. Only electricity is counted in the use stage while other inputs such as water are excluded. Also, sensitivity analysis, analysis of co-products and by-products are considered out of the boundaries in this study.
Hybrid MFA-LCA
The use of MFA and LCA are complementarity and provide a comprehensive overview of products and services.
The results derived from MFA is a visualization of the balance between material inputs and outputs. It provides information about stocks of material in a certain period (Hendriks et al., 2000). When combining with periodic analysis or life span calculation, MFA can also “assess future off-flows from stocks, such as future waste generation or change in waste composition” (Allesch and Brunner, 2015, p. 754).
However, environmental indicators are not included in MFA (Allesch and Brunner, 2015). The combination of LCA with MFA methods can therefore provide environmental data on what elements or processes could be improved or avoided to achieve a balance of economic development and environmental sustainability (Hinterberger et al., 2003).
Results and discussion
Findings from MFA
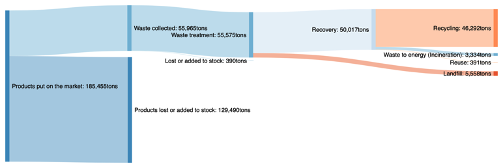
Fig 2. Sankey diagram of SHA flows in the UK in 2016 (Source: own elaboration based on EUROSTAT)
There were 185,455 tons of SHA put on the market in 2016, with the significant discrepancy between the products put on the market and the waste collected from authorised channels. 55,965 tons (30%) were collected and the rest were assumed as product loss or added to stock.
Form the 55,965 tons of waste collected, 55,575 tons were treated locally in the UK and none of it was treated within the EU or outside the EU. 390 tons were assumed as loss or added to stock. Among all the waste treated, 50,017 tons were recovered and being recycled, reused and incinerated. As there are no statistics about export, the difference between waste treated and waste recovered is assumed to be sent to landfills. Most of the SHA went to recycling and a negligible amount was reused.
The Sankey diagram showed a high recovery rate for the waste collected in the UK. However, when we accounted for the whole material flows, a large amount of "products lost/ added to stock" did not proceed to waste collection stage. They might neither be stored at home, mixed with municipal solid waste, or illegally exported (Domenech and Van Ewijk, 2015).
One limitation of the data is that it did not show how much recycled materials were sent back to market use (Domenech and Van Ewijk, 2015). The circularity of recycled materials in the SHA market is therefore unknown.
Findings from LCA
The life-cycle of electric kettles included three stages: assembly, usage and waste disposal. In an optimistic and realistic scenario, both scenarios showed that the use phase had contributed the most to environmental impact, which is consistent with previous research on electric kettles (Gallego-Schmid et al., 2018; Grzesik and Guca, 2011; Marcinkowski and Zych, 2017).
The high environmental impact in the use stage might have contributed to the electricity mix in the UK. In 2016, 42.2% of electricity generated was from natural gas, while 22%, 21.1% and 9% were from renewables, nuclear power and coal. The rest of 3.1% was from oil and other miscellaneous sources (Department for Business, Energy & Industrial Strategy, 2018). Natural gas played a vital role in providing electricity in the UK. Although it was regarded as a greener option concerning greenhouse gas emissions compared with coal and oil (Faramawy et al., 2016), the operations of power plants could produce toxic substances which impacted the environment and human health (Turconi et al., 2013). In 2016, there were 37.4% of inland energy conversion loss and 14.7% of distribution loss of electricity (Department for Business, Energy & Industrial Strategy, 2017). If the plant had low energy efficiency, it would require more energy production for end-use (Laitner, 2013).
Both waste scenarios also showed five impact categories with a dominating impact on the environment: natural land transformation, marine ecotoxicity, freshwater ecotoxicity, freshwater eutrophication and human toxicity. We can look into the electricity mix, plastics and metals elements used in the kettle lifecycle to understand why.
Take natural gas as an example. The drilling in natural gas well sites could lead to soil erosion, resulted in a runoff of sediment which polluted the water and affected the ecosystem (Williams et al., 2008). For example, the research found the freshwater near natural gas wells in the United States were contaminated by methane (Osborn et al., 2011). Besides, the nutrients from the soil, such as nitrogen and phosphorus, could bring into the water which led to eutrophication (Wetzel, 2001). The chemicals used in natural gas drilling contained substances which could impact human respiratory and nervous system (Colborn et al., 2011). Even though only half of the natural gas came from the production in the UK (British Gas, 2017), the environmental and human health impact caused by natural gas well drilling should not be underestimated.
On the other hand, the establishment of electricity generation plants would take up land spaces and affect the natural habitat. Take wind power, which is a common type of renewables used in the UK, as an example. Research indicated "[t]he development of wind power will cause land use change and modify landscape settings, which will impact upon the living space, biological system and regional earth surface system, including noise pollution, bird and bat fatalities, GHGs and surface climate.” (Wang and Wang, 2015, p. 438).
For the assembly stage, one research looked into the improper treatment of sewage in the industrialised area in Shenzhen which led to metal contamination in rivers (Wu et al., 2016). The water could enter the drinking water system and impact human health. Another research from China investigated the chemicals in slag – a by-product produced during the metal refining process and confirmed its toxicity (Bao et al., 2016).
In the process of plastic incineration, toxic gases were released. Improper emission of fumes and dumping of incineration ash could lead to air pollution, water and soil contamination (Verma et al., 2016). There was a research that suggested the improvement of WEEE material separation technology to lower the environmental impact (Cesaro et al., 2017).
Findings from the perspective of hybrid MFA-LCA and implications
MFA provided a macro view on the flow of wasted SHA in a country while LCA provided a micro view of how a specific SHA product could impact the environment.
The MFA illustrated a gap between waste recovery and products put on the market. However, it could not tell if the pursuit of a higher recovery rate could necessarily improve the environment. The LCA results showed there was no significant environmental improvement in the optimistic scenario for the electric kettle, even though there were some environmental credits given for higher recycling compared with the realistic scenario, as shown in the characterization result. The MFA could not provide such insights.
Therefore, finding ways to lower electricity usage in the use stage may reduce environmental impact to a greater extent. For example, regarding energy input, the restructuring of the energy mix in the UK to higher renewable proportion may make a difference; for people's behaviour, the user could shorten the use time by boiling only the exact amount of water they needed.
At the same time, LCA provided environmental information on various material inputs being treated in landfill, incineration or recycling stage while MFA could only provide the amount of waste treatment flows. For example, MFA showed that most of the SHA in the recovery stage went to recycling while the LCA, such as a realistic waste scenario, could specify the impact bought by 95% recycling rate of metal and one-third of the recycling rate of plastic. These differences could not reflect in the MFA. The environmental impact data showed in LCA could then act as a reference to formulate targeted strategies to reduce the impact of certain materials. In this case, the implication of a low plastic recycling rate provided insights on using policy instruments or improvement in manufacturing procedures to improve the situation.
Policy recommendations and challenges
Based on the LCA analysis, the UK government could focus on providing policy support to reduce the environmental impact of electric kettles in the use stage.
A framework from Grubb, Hourcade and Neuhoff (2015) was used to illustrate the policy recommendations. It provided three pillars on policy formation, namely standards and engagement, markets and prices and strategic investment. Moreover, to be an effective policy, it should also complement three domains namely satisfice, optimise and transform (Grubb, Hourcade and Neuhoff, 2015).
Suggestion 1: Raise awareness on efficient use of kettle via public education
In 2013, the research surveyed around 86,000 UK citizens and 75% of respondents admitted they overfilled the kettle, which could cost an extra £68 million per year for electricity bills (Energy Saving Trust, 2013). Therefore, the main message for the public would be not to overfill the kettle.
The means for public education could be via social media, promotion posters in a residential notice board or electric kettle retailers. However, the effectiveness is unknown as human behaviour is hard to alter and the cost of monitoring the problem of kettle overfilling in each household could be high.
Suggestion 2: Introduce standards for kettles and phase out inefficient kettles products sold on the market
In 2009, the European Union (EU) introduced the Ecodesign Directive to improve the efficiency of electrical appliances, such as televisions, lighting products and vacuum cleaners (European Commission, 2019). The electric kettle was in the working plan in 2016 but it was still under review. Also, with the uncertainty of whether the UK will continue to follow the UN standards due to “Brexit”, the government could first set up guidelines to classify energy-efficient and environmental-friendly kettle. Standardised energy-saving labels can be awarded on product packaging. For products that did not meet the requirement, the government should gradually phase them out by setting up timelines.
To ensure a smooth transition, this policy is not legally binding at the beginning as the public need time to adapt. The government should also be aware of criticism and opposition from the manufacturing and business sector which could hinder the implementation.
Suggestion 3: Provide incentives for industry to develop innovative eco kettle design
In 2017, it was estimated that 95% of UK households owned a kettle (Statista, 2017). A considerable amount of energy and resources could be saved if all the households use a new design of kettle which can require fewer materials, remind user not to overfill while achieving higher energy efficiency.
The government could provide subsidy/ tax reduction in the research and development process of new kettles to encourage manufacturers to break the status quo of current kettle design. Government intervention in product development could minimise the “lock-in” effect, which is a common obstacle for sustainable innovation (Foxon, 2002).
Gallego-Schmid et al. (2018) conducted LCA on three types of kettles (plastic, metallic and kettle with temperature control and lower energy use) and applied into three scenarios (current situation, improved water efficiency and temperature control). They suggested water efficiency improvement was the most crucial element to consider in kettle design as it could reduce one-third of the current environmental impact from the kettle within the EU, while durability and water temperature control only contributed to less than 5% reduction.
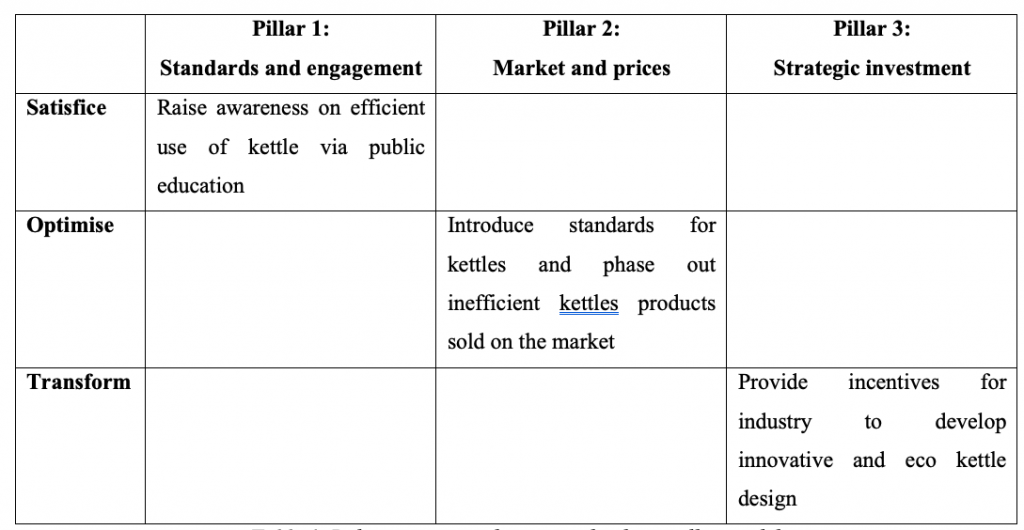
Table 1. Policy recommendations in the three-pillar model
Conclusions
This essay provided analysis on SHA flow in the UK using MFA and the environmental impact bought by electric kettle in the UK using simplified LCA. The limitation of this LCA is the use of simplified material list and exclusion of some life cycle stages and transport process. While for MFA, the extent of circularity of recycled materials cannot be shown due to the limited data availability in EUROSTAT.
The MFA and LCA methods are complementing with each other. For example, MFA could provide a macro view of SHA waste material flow while LCA could provide a micro view on the environmental impact of a specific SHA.
The MFA result showed most SHA put on the market did not enter the waste collection stream. Moreover, in the stream of the materials being recovered, most of them were recycled. On the other hand, the LCA indicated the use phase of kettle had the most significant impact to the environment, while assembly stage and two waste scenarios – “realistic” and “optimistic” had little impact.
The above implications implied policies that are oriented to the electric kettle’s product end-of-life might not be the most effective. This essay, therefore, suggested three measures to lower the environmental impact created in the use phase and stated the potential implementation challenges to be considered.
References
- Allesch, A. and Brunner, P. H., 2015. Material Flow Analysis as a Decision Support Tool for Waste Management: A Literature Review. Journal of Industrial Ecology, 19(5), pp. 753-764.
- Bao, L., Li, J., Zeng, Y. and Wang, Z., 2016. Toxicity assessment and geochemical model of chromium leaching from AOD slag. Chemosphere, Volume 144, pp. 2052-2057.
- Bovea, M. D., Ibáñez-Forés, V., Pérez-Belis, V. and Quemades-Beltrán, P., 2016. Potential reuse of small household waste electrical and electronic equipment: Methodology and case study. Waste Management, Issue 53, pp. 204-217.
- British Gas, 2017. Where does UK gas come from. [Online] Available at: https://www.britishgas.co.uk/the-source/our-world-of-energy/energys-grand-journey/where-does-uk-gas-come-from. [Accessed 31 January 2019].
- Brunner, P. H. and Rechberger, H., 2004. In: Practical handbook of material flow analysis. Florida: Lewis Publishers, pp. 1-5.
- Cesaro, A., Marra, A., Belgiorno, V. and Guida, M., 2017. Effectiveness of WEEE mechanical treatment: Separation yields and recovered material toxicity. Journal of Cleaner Production, Volume 142, pp. 2656-2662.
- Clarke, C., Williams, I. D. and Turner, D. A., 2019. Evaluating the carbon footprint of WEEE management in the UK. Resources, Conservation and Recycling, Volume 141, pp. 465-473.
- Colborn, T., Kwiatkowski, C., Schultz, K. and Bachran, M., 2011. Natural Gas Operations from a Public Health Perspective. Human and Ecological Risk Assessment: An International Journal, 17(5), pp. 1039-1056.
- Department for Business, Energy & Industrial Strategy, 2017. UK energy in brief 2017. [Online]
Available at: https://www.gov.uk/government/statistics/uk-energy-in-brief-2017 [Accessed 31 January 2019]. - Department for Business, Energy & Industrial Strategy, 2018. UK Energy Statistics, 2017 & Q4 2017. [Online] Available at: https://assets.publishing.service.gov.uk/government/uploads/system/uploads/attachment\_data/file/695626/Press\_Notice\_March\_2018.pdf [Accessed 31 01 2019].
- Dindarian, A., Gibson, A. and Quariguasi-Frota-Neto, J., 2012. Electronic product returns and potential reuse opportunities: a microwave case study in the United Kingdom. Journal of Cleaner Production, Volume 32, pp. 22-31.
- Domenech, T. and Van Ewijk, S., 2015. Analysing impacts of product life extension through material flow analysis: the case of EEE and paper. Nottingham Trent University, PLATE conference.
- Energy Saving Trust, 2013. At Home with Water. [Online] Available at: https://www.energysavingtrust.org.uk/sites/default/files/reports/AtHomewithWater%287%29.pdf
[Accessed 31 January 2019]. - European Commission, 2018. A European Strategy for plastics in a circular economy. [Online] Available at: https://ec.europa.eu/environment/circular-economy/pdf/plastics-strategy-brochure.pdf [Accessed 31 January 2019].
- European Commission, 2019. Ecodesign. [Online] Available at: https://ec.europa.eu/growth/industry/sustainability/ecodesign\_en [Accessed 31 January 2019].
- Faramawy, S., Zaki, T. and Sakr, A.-E., 2016. Natural gas origin, composition, and processing: A review. Journal of Natural Gas Science and Engineering, Volume 34, pp. 34-54.
- Foxon, T. J., 2002. Technological and institutional ‘lock-in’ as a barrier to sustainable innovation. ICCEPT Working Paper.
- Frazzoli, C., Orisakwe, O. E., Dragone, R. and Mantovani, A., 2010. Diagnostic health risk assessment of electronic waste on the general population in developing countries' scenarios. Environmental Impact Assessment Review, 30(6), pp. 388-399.
- Gallego-Schmid, A., Jeswani, H. K., Mendoza, J. M. F. and Azapagic, A., 2018. Life cycle environmental evaluation of kettles: Recommendations for the development of eco-design regulations in the European Union. Science of The Total Environment, Volume 625, pp. 135-146.
- Ghosh, S. K. et al., 2016. Waste electrical and electronic equipment management and Basel Convention compliance in Brazil, Russia, India, China and South Africa (BRICS) nations. Waste Management & Research, 34(8), pp. 693-707.
- Grzesik, K. and Guca, K., 2011. Screening study of life cycle assessment (LCA) of the electric kettle with SimaPro Software. Geomatics and Environmental Engineering, 5(3), pp. 57-68.
- Hendriks, C. et al., 2000. Material Flow Analysis: A tool to support environmental policy decision making. Case-studies on the city of Vienna and the Swiss lowlands. Local Environment, 5(3), pp. 311-328.
- Herat, H. and Agamuthu, P., 2012. E-waste: a problem or an opportunity? Review of issues, challenges and solutions in Asian countries. Waste Management & Research, 30(11), pp. 1113-1129.
- Hinterberger, F., Giljum, F. and Hammer, M., 2003. Material Flow Accounting and Analysis (MFA): A Valuable Tool for Analyses of Society-Nature Interrelationships. Internet Encyclopedia of Ecological Economics.
- Ikhlayel, M., 2017. Environmental impacts and benefits of state-of-the-art technologies for E-waste management. Waste Management, Volume 68, pp. 458-474.
- Kumar, A., Holuszko, M. and Espinosa, D. C. R., 2017. E-waste: An overview on generation, collection, legislation and recycling practices. Resources, Conservation and Recycling, Volume 122, pp. 32-42.
- Ladou, J. and Lovegrove, S., 2008. Export of Electronics Equipment Waste. International Journal of Occupational and Environmental Health, 14(1), pp. 1-10.
- Laitner, J. A., 2013. An overview of the energy efficiency potential. Environmental Innovation and Societal Transitions, Volume 9, pp. 38-42.
- Lau, W. K.-Y., Chung, S.-S. and Zhang, C., 2013. A material flow analysis on current electrical and electronic waste disposal from Hong Kong households. Waste Management, 33(3), pp. 714-721.
- Lepawsky, J., 2014. The changing geography of global trade in electronic discards: time to rethink the e-waste problem. The Geographical Journal, 181(2), pp. 147-159.
- Marcinkowski, A. and Zych, K., 2017. Environmental Performance of Kettle Production: Product Life Cycle Assessment. Management Systems in Production Engineering, 25(4), pp. 255-261.
- Niu, X. and Li, Y., 2007. Treatment of waste printed wire boards in electronic waste for safe disposal. Journal of Hazardous Materials, 145(3), pp. 410-416.
- Osborn, S. G., Vengosh, A., Warner, N. R. and Jackson, R. B., 2011. Methane contamination of drinking water accompanying gas-well drilling and hydraulic fracturing. PNAS, 108(20), pp. 8172–8176.
- Rebitzer, G. et al., 2004. Life cycle assessment Part 1: Framework, goal and scope definition, inventory analysis, and applications. Environment International, 30(5), pp. 701-720.
- Statista, 2017. Share of households owning kettles in Great Britain from 2005 to 2017. [Online]
Available at: https://www.statista.com/statistics/656984/utility-ownership-home-development-kettle-gb/ [Accessed 31 January 2019]. - Steubing, B. et al., 2010. Assessing computer waste generation in Chile using material flow analysis. Waste Management, 30(3), pp. 473-482.
- Tansel, B., 2017. From electronic consumer products to e-wastes: Global outlook, waste quantities, recycling challenges. Environment International, Issue 98, pp. 35-45.
- Tran, H. P. et al., 2018. Material flow analysis for management of waste TVs from households in urban areas of Vietnam. Resources, Conservation and Recycling, Volume 139, pp. 78-89.
- Tsydenova, O. & Bengtsson, M., 2011. Chemical hazards associated with treatment of waste electrical and electronic equipment. Waste Management, 1(31), pp. 45-58.
- Turconi, R., Boldrin, A. and Astrup, T., 2013. Life cycle assessment (LCA) of electricity generation technologies: Overview, comparability and limitations. Renewable and Sustainable Energy Reviews, Volume 28, pp. 555-565.
- Verma, R., Vinoda, K. S., Papireddy, M. and Gowda, A., 2016. Toxic Pollutants from Plastic Waste - A Review. Procedia Environmental Sciences, Volume 35, pp. 701-708.
- Wang, S. and Wang, S., 2015. Impacts of wind energy on environment: A review. Renewable and Sustainable Energy Reviews, Volume 49, pp. 437-443.
- Wetzel, R. G., 2001. Limnology: Lake and River ecosystems. 3rd ed. San Diego: Academic Press.
- Williams, H. F. L., Havens, D. L., Banks, K. E. and Wachal, D. J., 2008. Field-based monitoring of sediment runoff from natural gas well sites in Denton County, Texas, USA. Environmental Geology, 55(7), pp. 1463–1471.
- WRAP, 2016. WEEE Material Flows Model and Report. [Online] Available at: https://www.wrap.org.uk/sustainable-electricals/esap/re-use-and-recycling/report/weee-market-flow-model-and-report [Accessed 12 January 2019].
- Wu, Q. et al., 2016. Contamination, toxicity and speciation of heavy metals in an industrialized urban river: Implications for the dispersal of heavy metals. Marine Pollution Bulletin, Volume 104, pp. 153-161.
Appendix
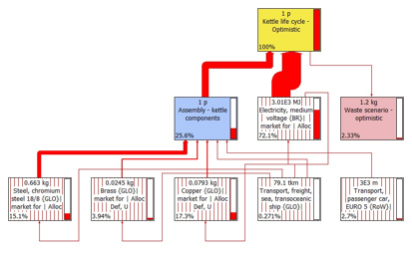
Table 1. Proportion of waste treatment of electric kettle in two scenarios
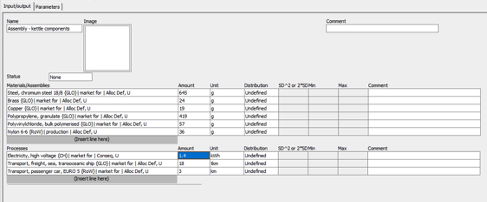
Fig 1. Input/ output in the assembly stage of electric kettles
Part 1: Optimistic Waste scenario
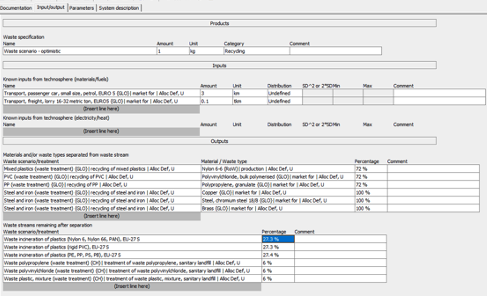
Fig 2. Input/ output in the optimistic waste scenario
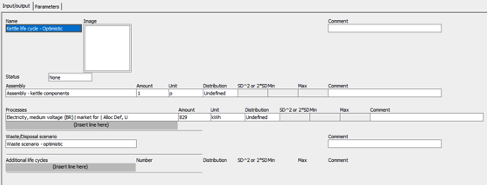
Fig 3. Input/ output in the life cycle of optimistic waste scenario

Fig 4. Life cycle impact assessment: characterisation from optimistic waste scenario

Fig 5. Life cycle impact assessment: normalisation from optimistic waste scenario
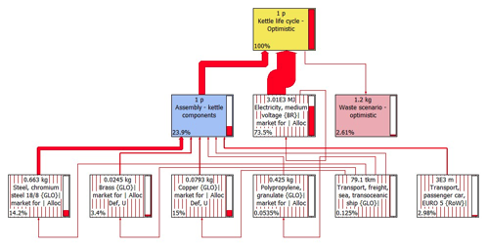
Fig 6. Impact categories: freshwater ecotoxicity from optimistic waste scenario
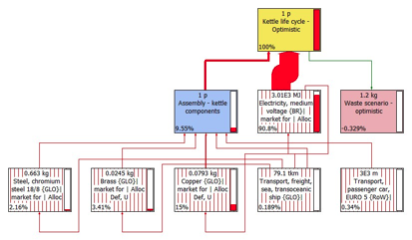
Fig 7. Impact categories: freshwater eutrophication from optimistic waste scenario
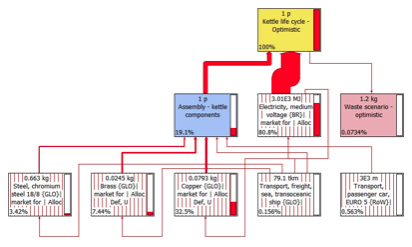
Fig 8. Impact categories: human toxicity from optimistic waste scenario
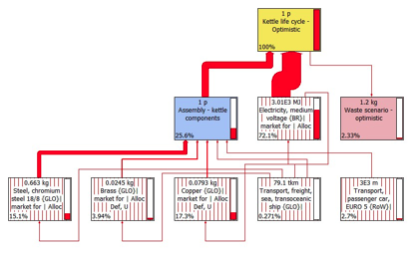
Fig 9. Impact categories: marine ecotoxicity from optimistic waste scenario

Fig 10. Impact categories: natural land transformation from optimistic waste scenario
Part 2: Realistic Waste scenario
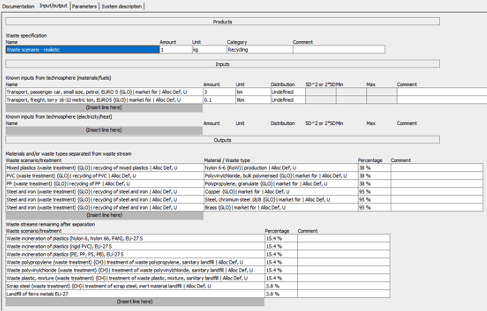
Fig 11. Input/ output in the realisitc waste scenario
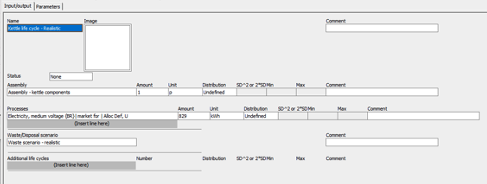
Fig 12. Input/ output in the life cycle of realistic waste scenario
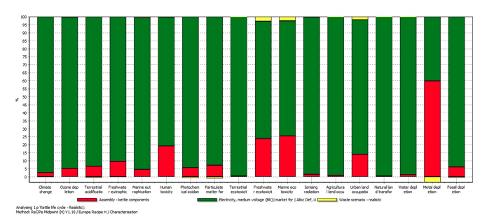
Fig 13. Life cycle impact assessment: characterisation from realistic waste scenario
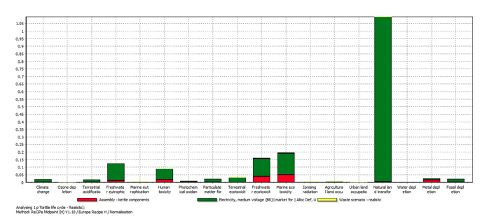
Fig 14. Life cycle impact assessment: normalisation from realistic waste scenario
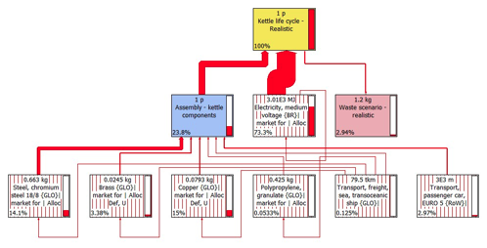
Fig 15. Impact categories: freshwater ecotoxicity from realistic waste scenario
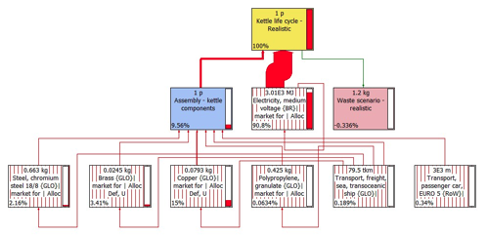
Fig 16. Impact categories: freshwater eutrophication from realistic waste scenario

Fig 17. Impact categories: human toxicity from realistic waste scenario

Fig 18. Impact categories: marine ecotoxicity from realistic waste scenario
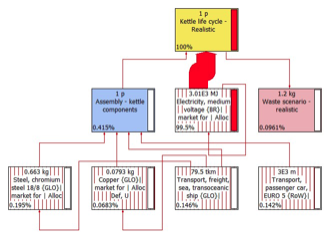
Fig 19. Impact categories: natural land transformation from realistic waste scenario
Comments